Aquacultural production
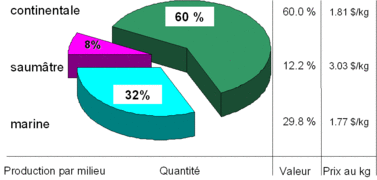
World aquaculture production totals 2005
All species (animals and plants)
Quantity: 62 960 000 tonnes
The percentages below the tonnage figures indicate the change compared with 2004. Brackish water aquaculture increased by more than 12%
Value: 78 billion US $
The figures on the right represent overall value per kg of aquacultural species produced in the different types of water. These values tell us something about the purposes of the types of aquaculture in these different environments :
- Inland aquaculture (1.27 $/kg) tends to be subsistence aquaculture, providing low cost protein for local populations.
- Aquaculture of brackish waters (3 $/kg) covers produce for exportation (salmon, shrimps/prawns).
The case of marine aquaculture is more complex as it includes aquatic plants and molluscs, which are mostly of low value.
Aquacultural production excluding aquatic plants
Quantity: 48.2 million tonnes
| 34.5 % | 1.47 $/kg |
16 % | 3.04 $/kg | |
49.5 % | 1.27 $/kg | |
répartition par milieux (quantité) | value | price per kg |
Most aquaculture of aquatic plants (99%) is done in marine zones. This explains the decrease in the proportion of marine aquaculture (from 50% to 34.7% in terms of quantity) and its increase in terms of value per kg when plants are not included.
FAO 2007 (2005 data)


